Facebook
 X
X
 Pinterest
 Copy Link


Things are changing rapidly these days, and if I had a dollar for how many times I have said “one day-at-a-time” over the last two weeks, I’d have a nice stack of cash. There are lots of questions swirling about simple everyday life and big life decisions like buying and selling real estate. I’m a believer in studying the numbers and sharing that data. It has always been my practice in my business to provide my clients with the information they need to help empower their decisions. With that said, I did a real-time pull of numbers on 3/18/20 in order to gain some understanding of the current trends amongst the COVID-19 outbreak.
I pulled three different market areas: Lake Stevens (North Snohomish County), Lynnwood (South Snohomish County) and Shoreline (North King County). I felt this would give a good representation of some different geographical markets and would avoid making any sweeping observations.
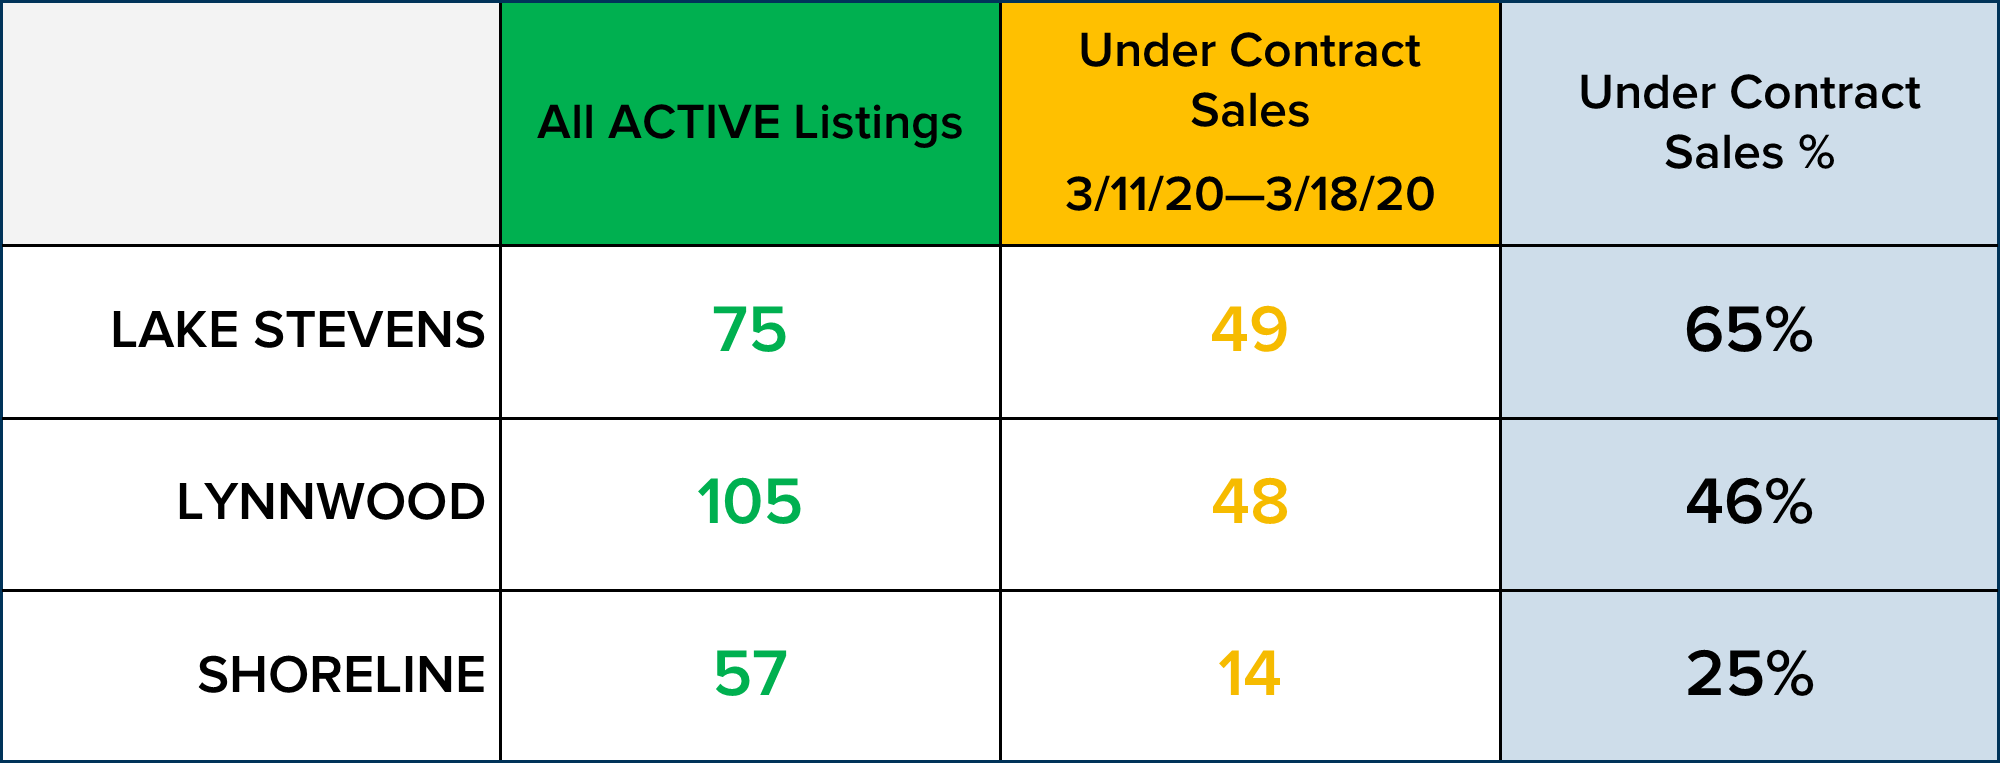
Below is an accounting of all of the active listings on the market in each of these cities along with all of the sales that went under contract from 3/11/20 to 3/18/20 (pulled around 1:30 pm PST) and the percentage relationship between those numbers. As you can see, we have had quite a bit of sales activity over the last week. Schools shut down through April 24th on 3/12/20 and restaurants and bars closed for dine-in business on 3/16/20, and homes continued to sell. We are certain that the historically low interest rates are fueling this demand. As of 3/17/20, the rate for a conventional, conforming loan was right around 3.5 – 3.65%.
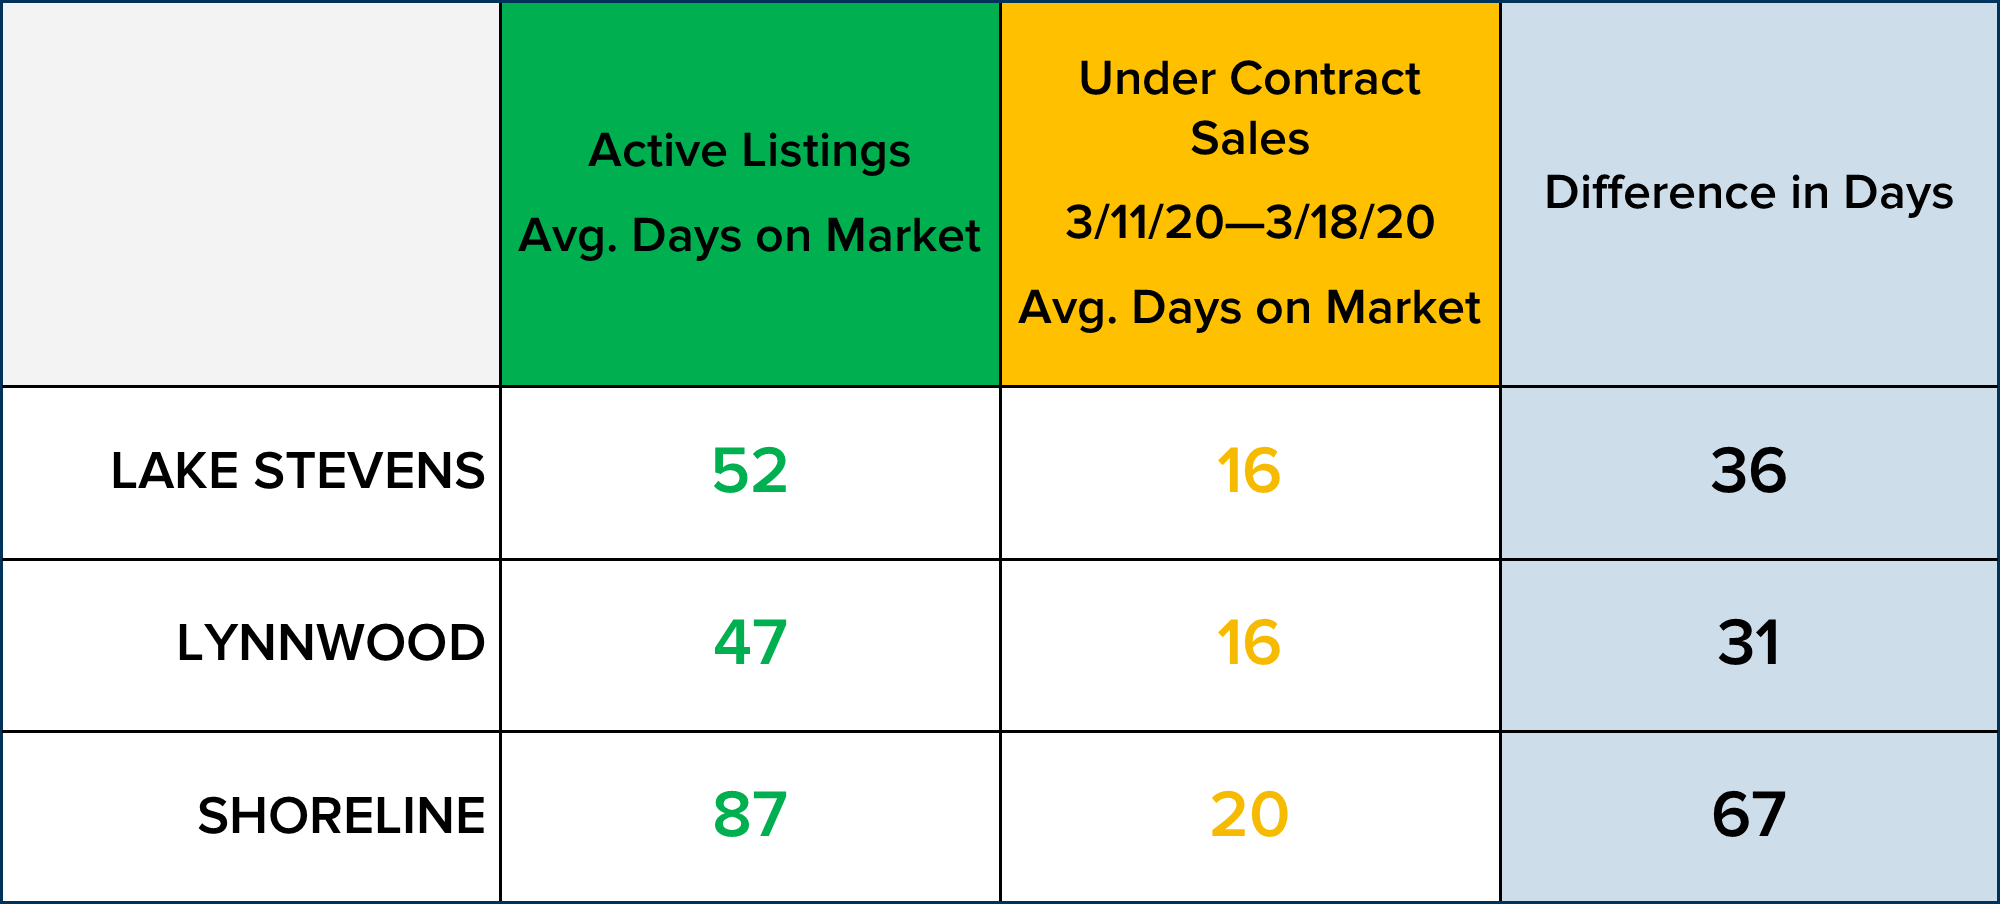
Below you can see a chart that reports the average days on market for the homes that are currently active and the homes that went under contract over the last week. The average days on market for the homes that were absorbed over the last week were markedly shorter, indicating that the homes that sold were newer to the market, well-presented, and appropriately priced. The longer market times for the actives indicate possible overpricing, as the average days on market for the month of February were 27 for Lake Stevens, 53 for Lynnwood, and 50 for Shoreline. This also shows a trend for March average days on market to be shorter than February.
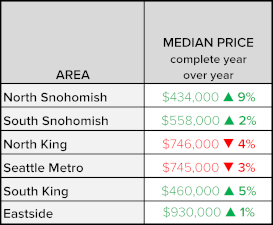
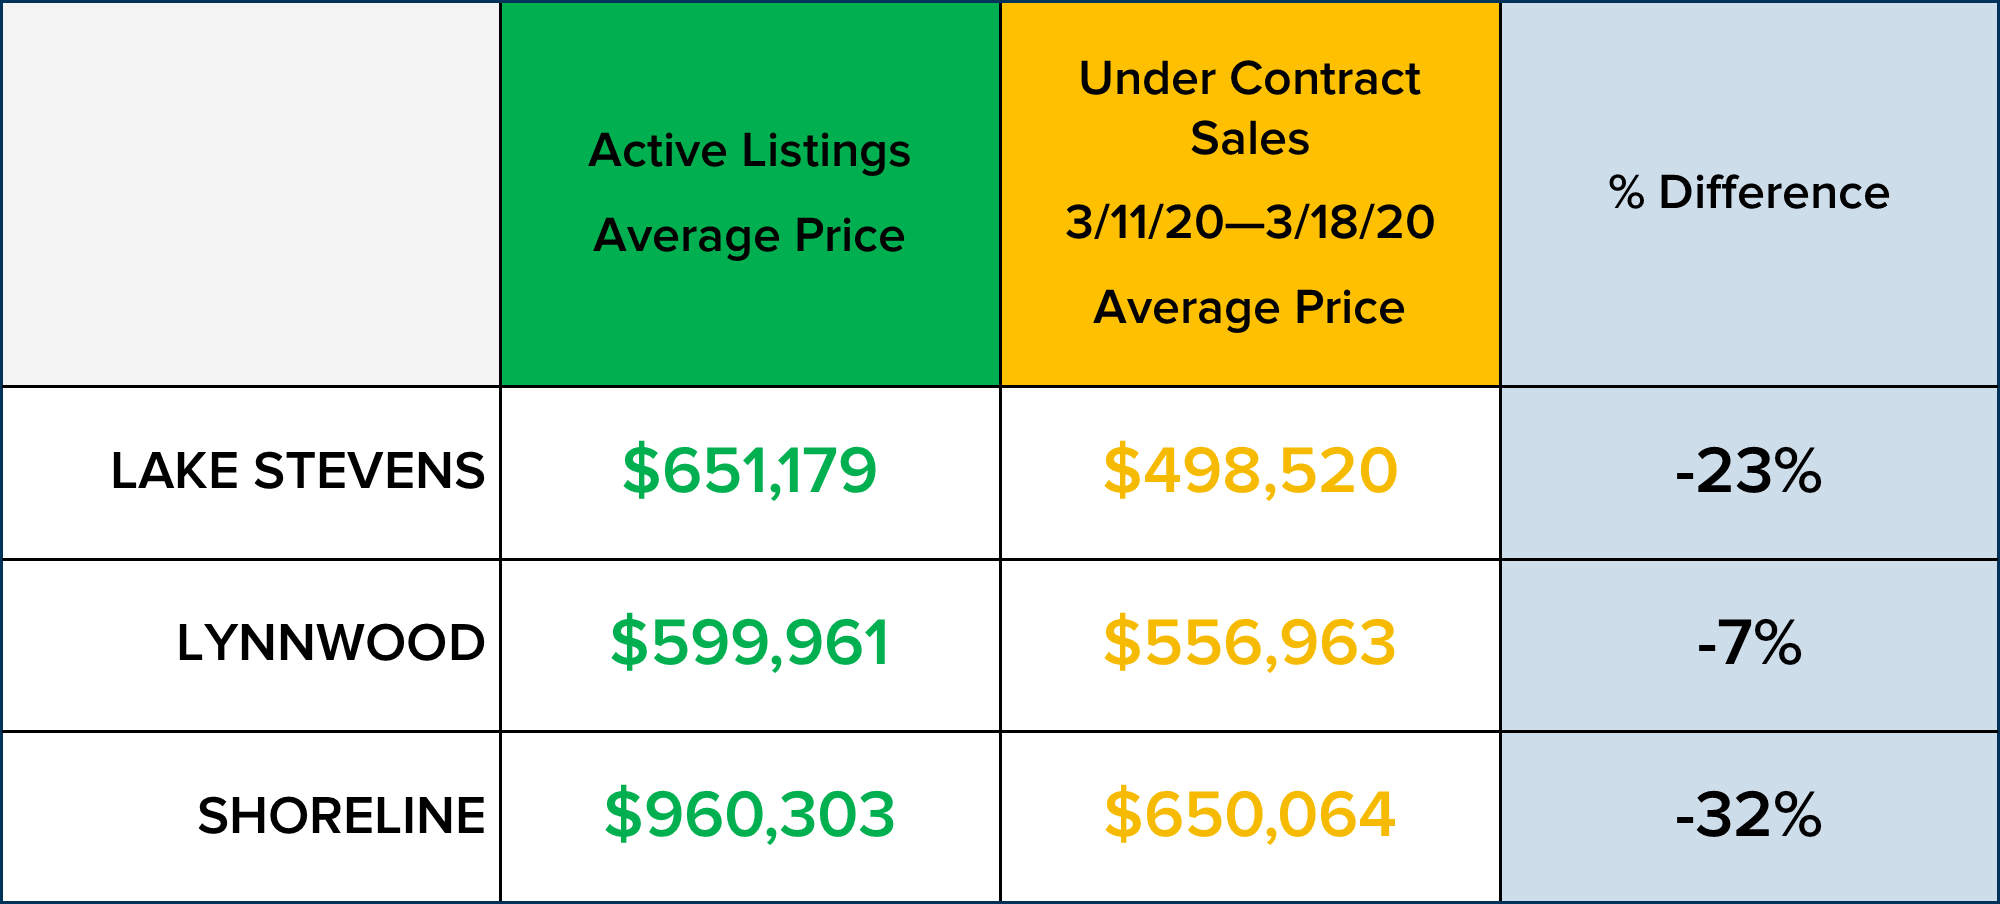
The last set of data that I pulled below is the average prices of the active listings and the average prices of the homes that went under contract last week. These percentage differences are in line with a similar comparison from February. In February, the percentage difference in the average active list price to the sold price was -22% in Lake Stevens, -9% in Lynnwood, and -29% in Shoreline. Since the under-contract sales have not published a closed sale price yet, we cannot take into consideration if there were any escalations above the list price. With the shorter-than-normal days on market and the stories I am hearing on the front lines of multiple offers, I believe we will have some escalations reported once these transactions close. I am sure there will be some concessions reported as well.
You may be wondering if this is still a good time to buy or sell, and the answer to that is different for each person. What I can say with certainty is that I am committed to bringing current facts and statistics to our conversations, and answering your questions as best I can. I hope you found the above figures to be encouraging, I did! Real estate is a cyclical business, and although the current economic shifts may be unsettling, we have weathered these cycles before. At this moment, record-low interest rates and low inventory are creating continued demand for homes, and from the figures reported, homes are going under contract. This is what I know today, and I felt it was worth sharing.
Below is a video from Windermere’s Chief Economist, Matthew Gardner that was released on Monday, 3/16/20 assessing the fate of the Greater Seattle real estate market during this time. Please contact me with your questions and concerns, I am here to help keep you informed!
Be well!


At this time, we are still planning to hold our annual Shred Event and Food Drive on April 18th. We will update you if anything changes due to crowd requirements and your safety.
This event will be vitally necessary to help stock our local food bank, which is struggling to meet demands. We also know that since many of you are staying home for extended periods of time, you will be cleaning and organizing, and will need the shredding services come April. We hope to meet these needs and bring our community together in a safe way.
Celebrate Earth Day with us! We are partnering with Confidential Data Disposal for our 9th year; providing you with a safe, eco-friendly way to reduce your paper trail and help prevent identity theft.
Saturday, April 18th, 10AM to 2PM
4211 Alderwood Mall Blvd, Lynnwood
Bring your sensitive documents to be professionally destroyed on-site. Limit 20 file boxes per visitor.
We will also be collecting non-perishable food and cash donations to benefit Concern for Neighbors food bank. Donations are not required, but are appreciated.
Hope to see you there!
**This is a Paper-Only event. No x-rays, electronics, recyclables, or any other materials

One of the most important lessons I’ve learned is the power of mindset. It is proven that what you focus on, expands. Setting aside time every day to focus on gratitude has been hugely beneficial in my business as well as my personal life, and I am finding this discipline to be even more important in today’s uncertain world. We are surrounded with scary news, unprecedented government announcements, and a whole lot of uncertainty. We are in uncharted territory, but the one thing we do have control over, is our own mindset.
Here are a few practical ideas to foster positivity in your life.
Daily Gratitudes. Carve out just a few minutes every day to write down two or three things you are grateful for. Make this part of your morning routine to help center yourself before the day begins, or part of your evening routine to help calm your mind before bed.
Savor small moments. No matter what situation you find yourself in, there are still many small moments to be enjoyed. The smell of coffee in the morning, or the quiet house in the evening when the children are all asleep. A hot shower or a luxurious lotion. Don’t rush through these. Stop and take a moment to really enjoy.
Look to the past. Humans are resilient. You have weathered uncertain times before, perhaps during the Great Recession, 9/11, or a major natural disaster. You made it through those, and you are stronger and better for the experience. Take a moment to look back at all you have been through as a reminder of your own resilience.
Follow social media accounts that provide good news only. There is quite a bit of doom and gloom out there right now. In addition to watching some funny YouTube videos or some heart-warming animal stories on Facebook, make sure you are plugged in and following some accounts that are all good, all the time. Some good ones on Facebook are
@GoodNewsGMA
@TanksGoodNews
@GoodNewsMove
If you’re on Instagram, be sure to check out
@Good
@UpWorthy
@TanksGoodNews
@GoodNews_Movement
Take social media breaks. This will be important. Not only because social media can be a hotbed of misinformation, but it can also provide an overload of general information. Many people are beginning to feel overwhelmed with the sheer amount of news, suggested kids activities, and overall noise happening on all social channels right now. Take some time every day to be intentional about closing these apps, putting your phone or laptop away, and focusing your attention on something else. #DigitalDetox
Above all, be deliberate with integrating positivity into your daily life, knowing that together, we will get through this.
If you have ideas of how to stay positive, please share them with me!